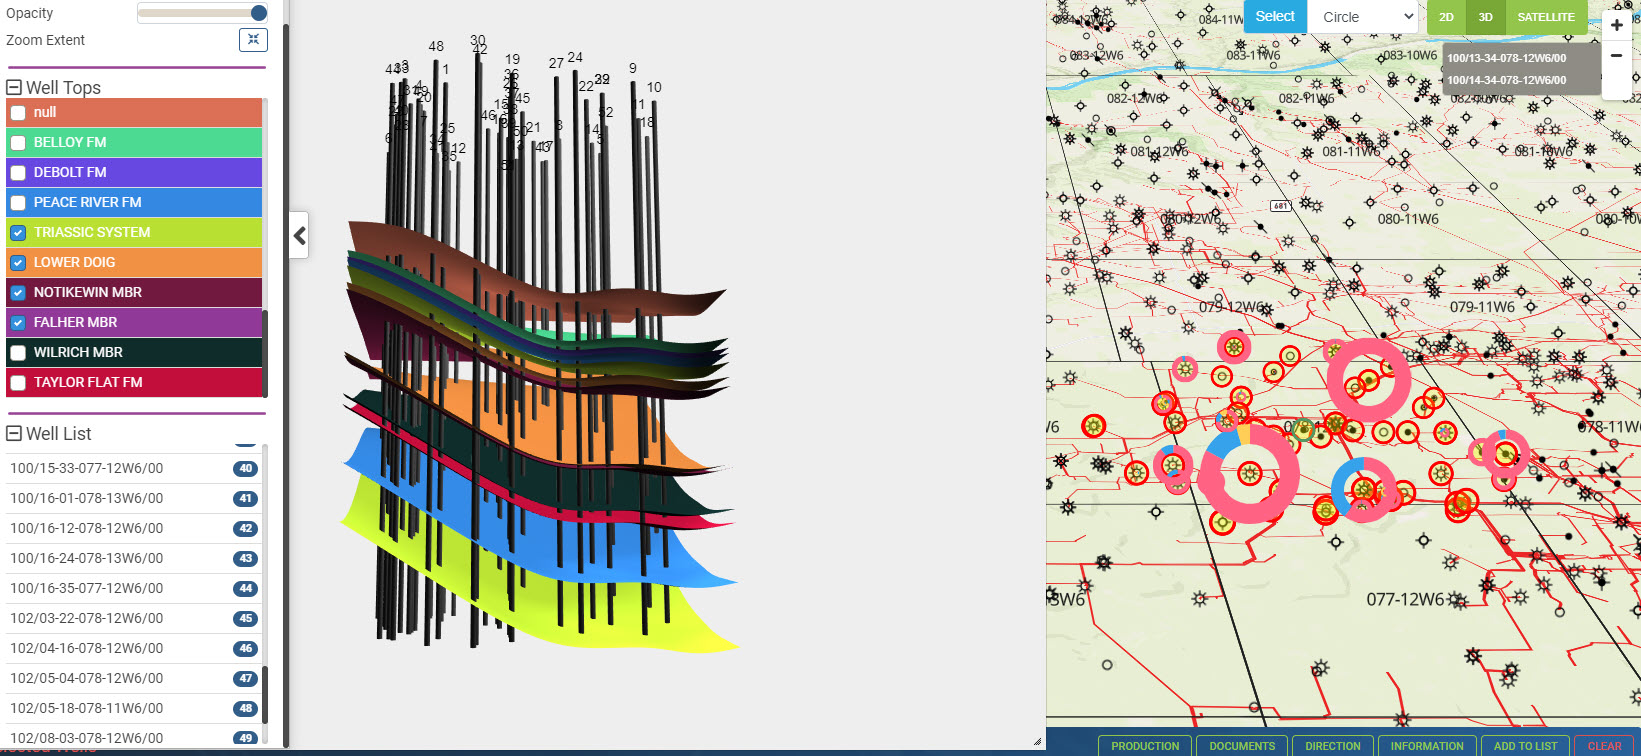
3d subsurafce visualization of wells.
Ease in visualizing formation thickness and depth with displayed well tops selection feature, production pie charts and editing well lists
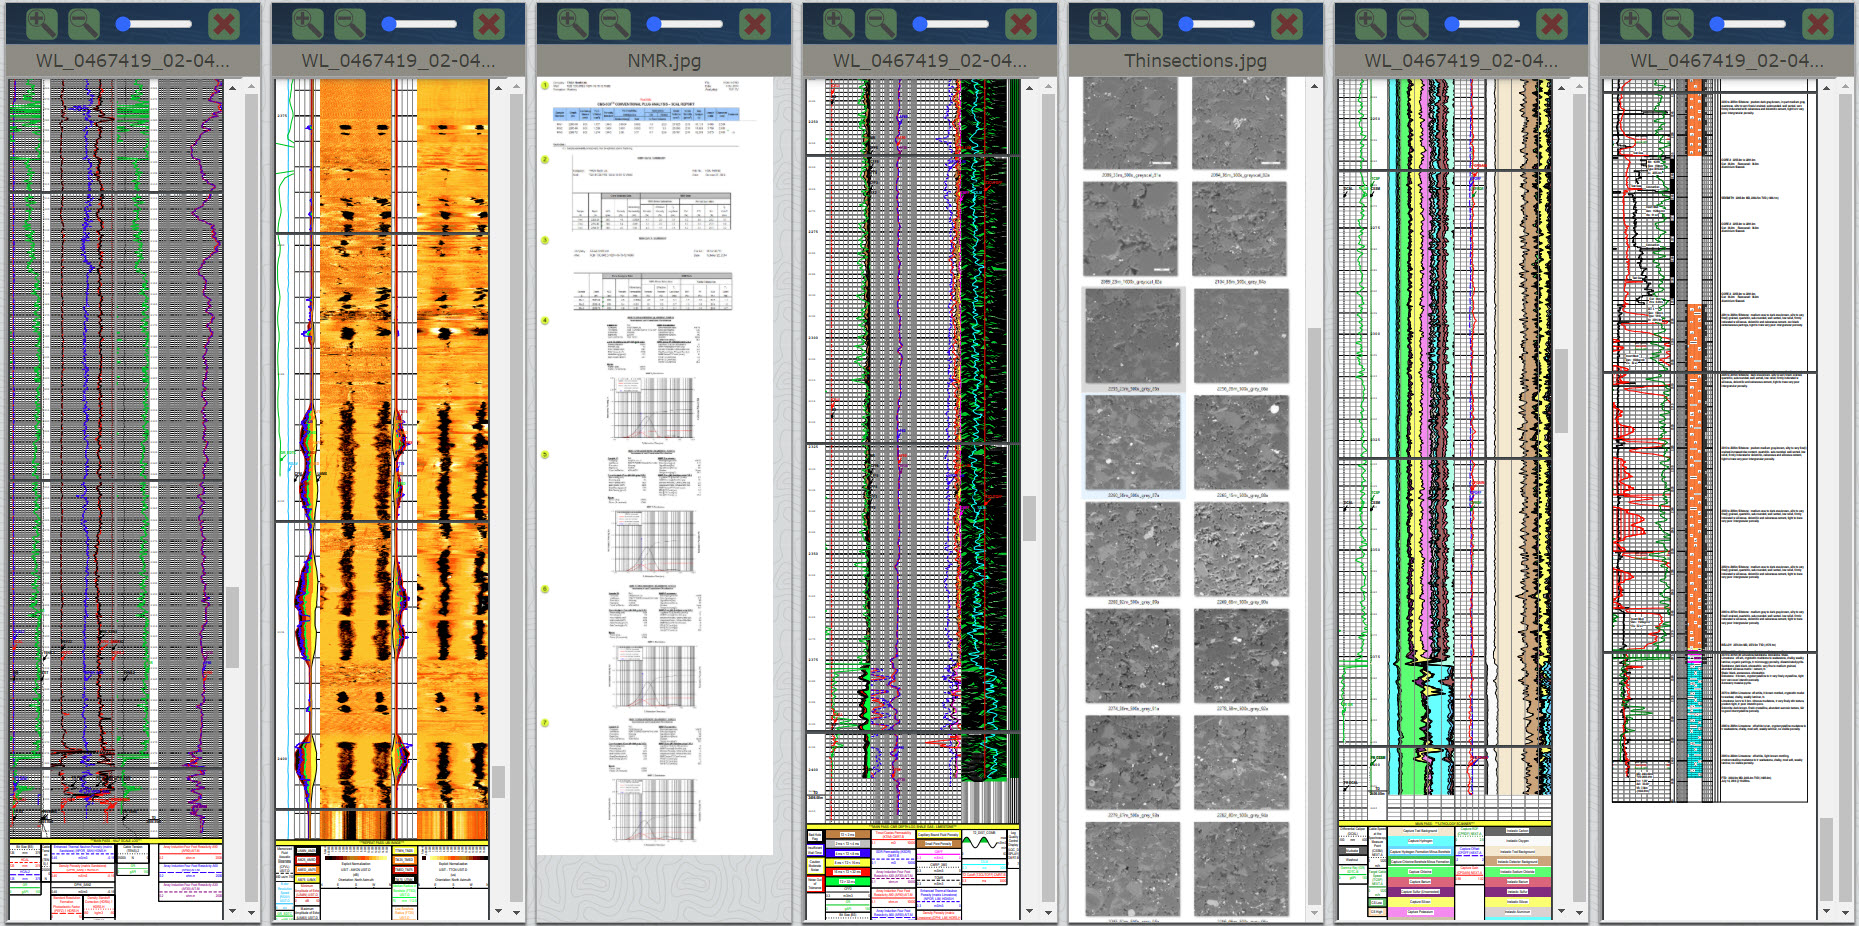
Well log correlation with Thin Section and Report.
Triple combo log, Highend log, core cutting thin section and report in one-page visualization for enhanced formation interpretation and visualization experience.
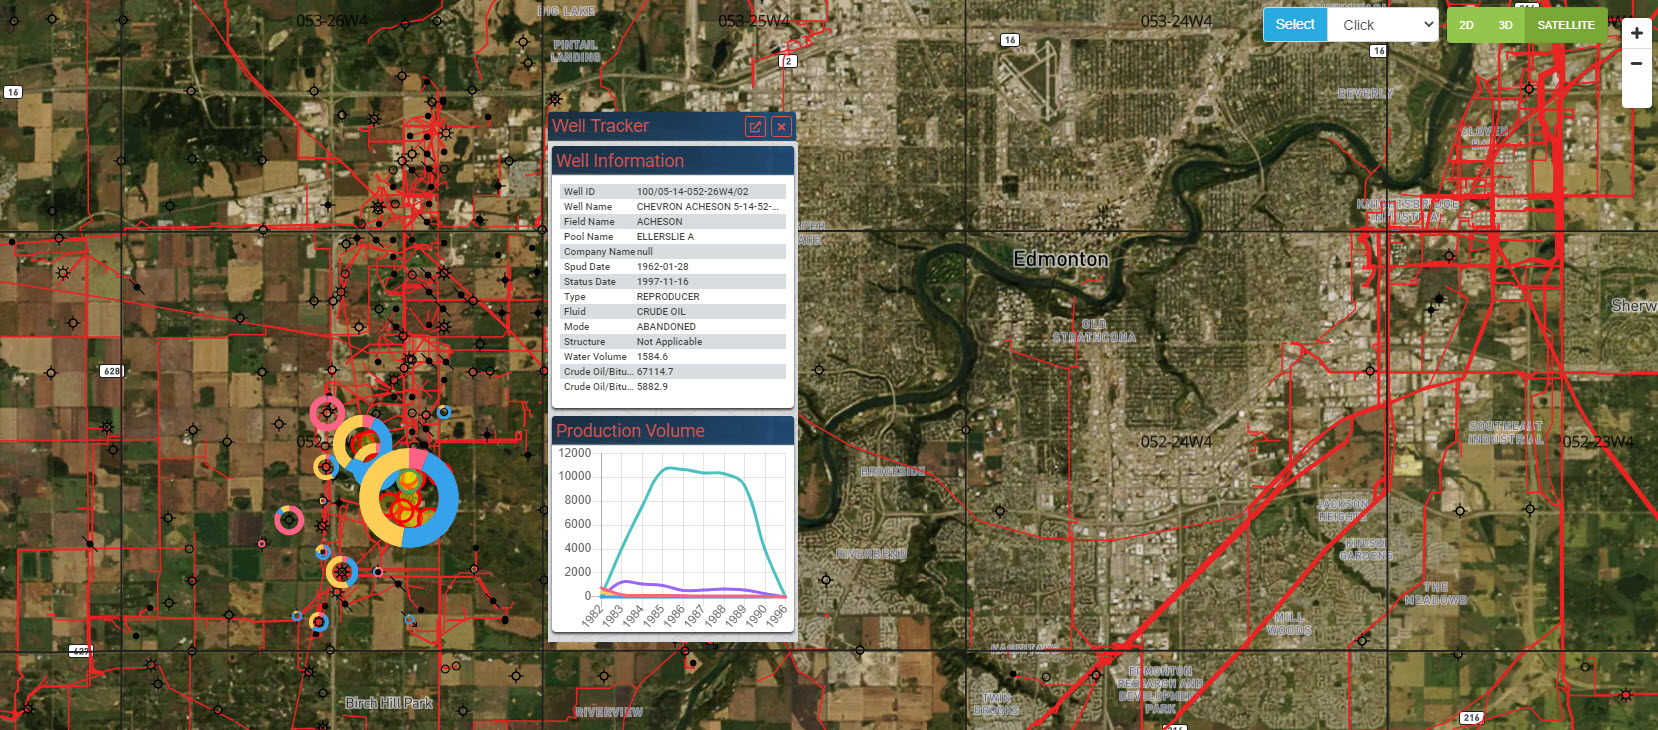
Production Pie Chart on a satellite map with quick tracker.
Histrorical production plots through pie chart and well information with the scroll of mouse tracker for a quick look analysis
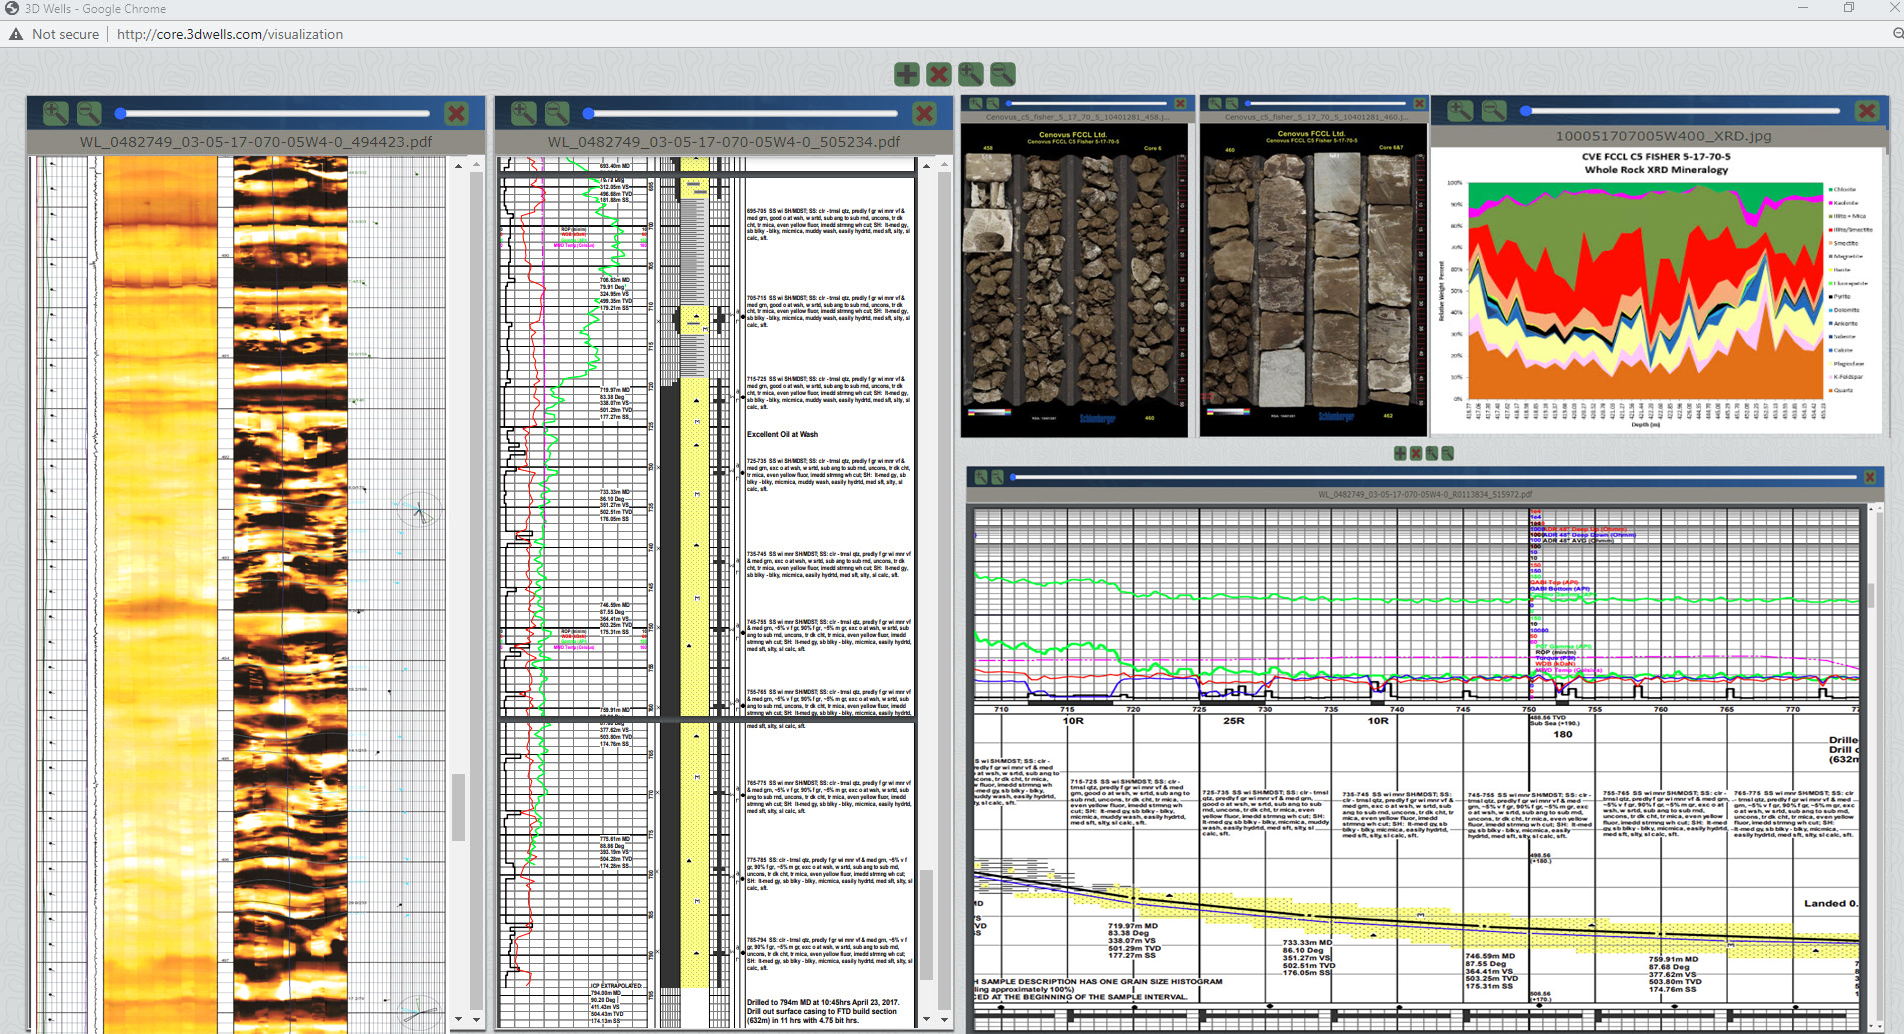
Highend well logs, vertical vs horizontal striplog, Core with XRD presentation by 3Dwells
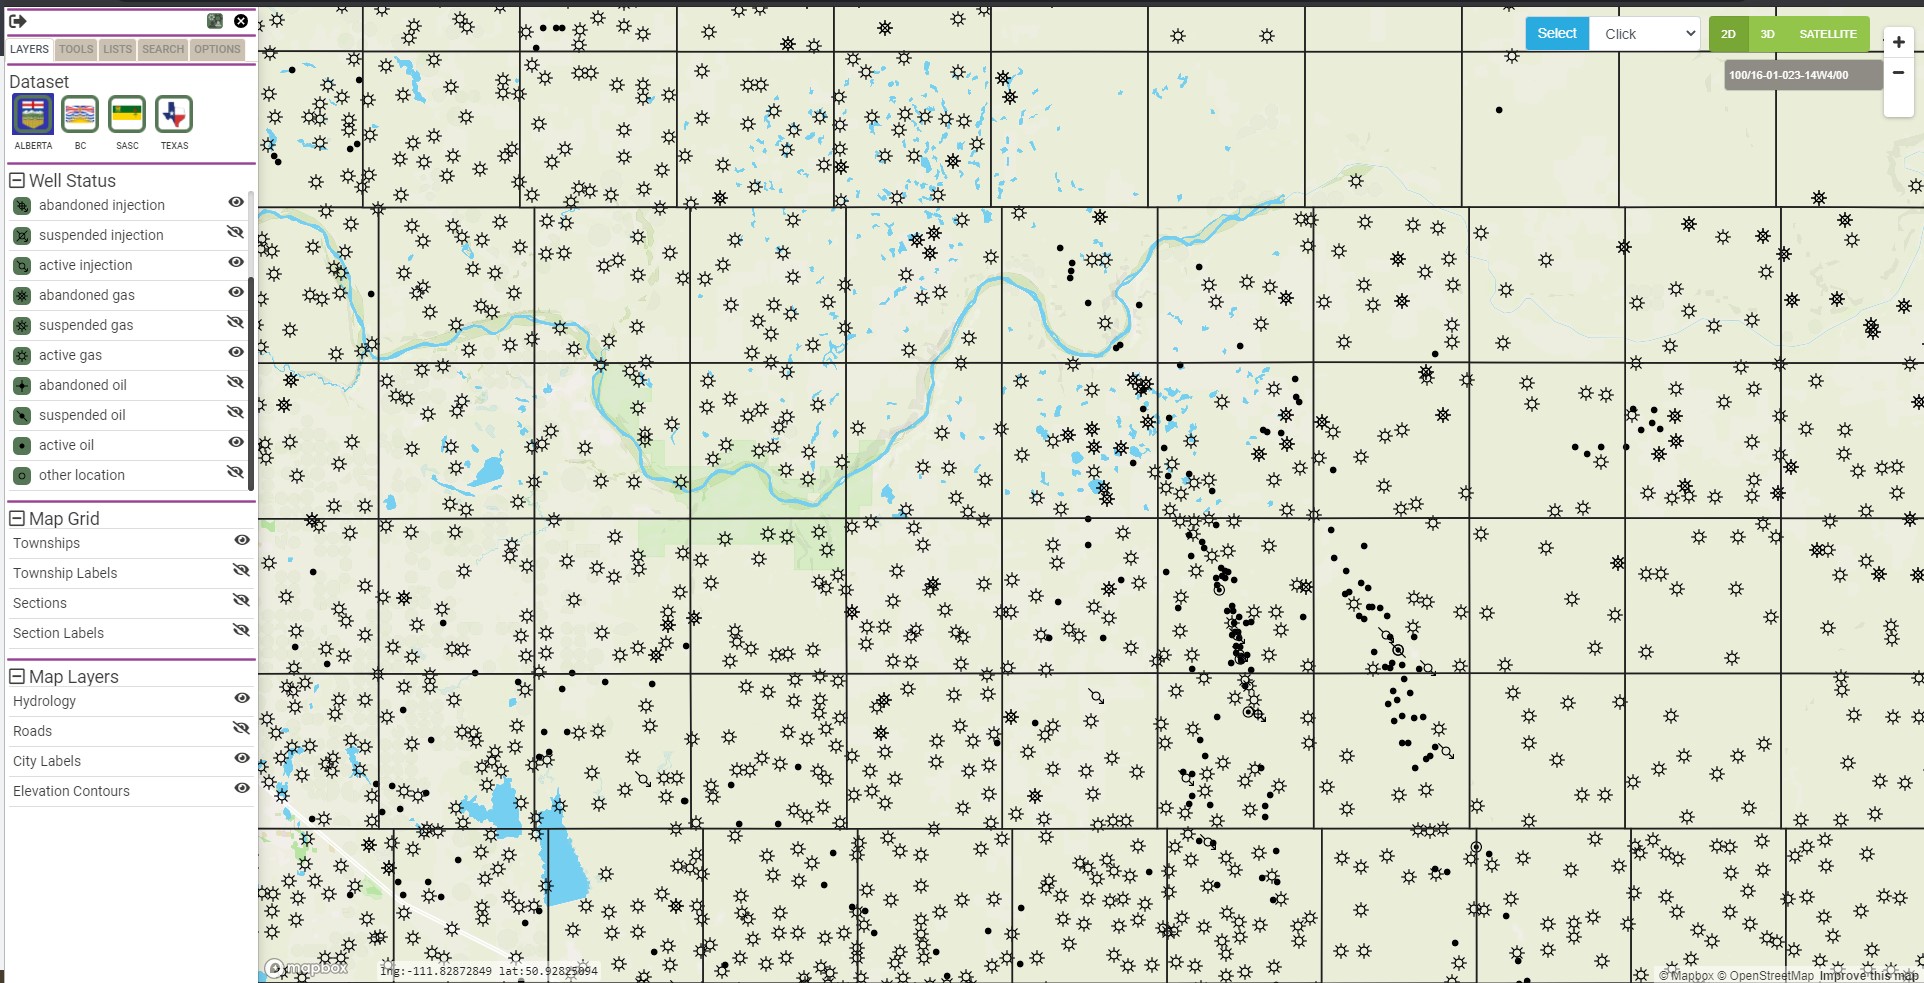
One Screen toggle on/off layers.
Quick selection to display based on your project, from types of wells to map details
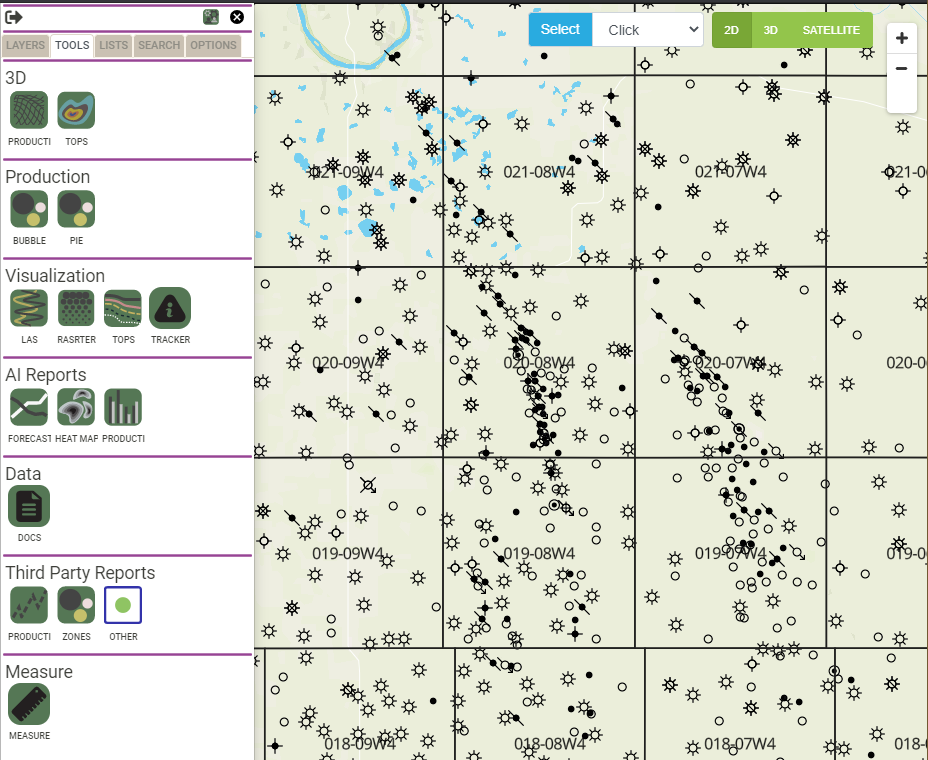
Data-driven tools
production pie charts, bubble map, formation tops, las basic log calculator and more in progress